

Moldflow Analysis Consulting
Designing an injection molded part?
Injection molding is a complex process!
Vital to the success of any project is the ability to evaluate
& identify part design and warpage related issues prior to "cutting steel."
What happens if the part fails in application,
warps, or if the quoted cycle time is not achievable?
Who pays the price?
Since 1988, CAE Services has been providing Moldflow services for OEMs, product designers, mold builders, and injection molders.
Today, we offer a turnkey solution approach; DFM, Moldflow analysis, sampling support, and analysis implementation.
If you're looking to improve product
to market cycles and need to
"Get it Right the First Time," call us today and join our team of satisfied clients!

Moldflow Analysis Services
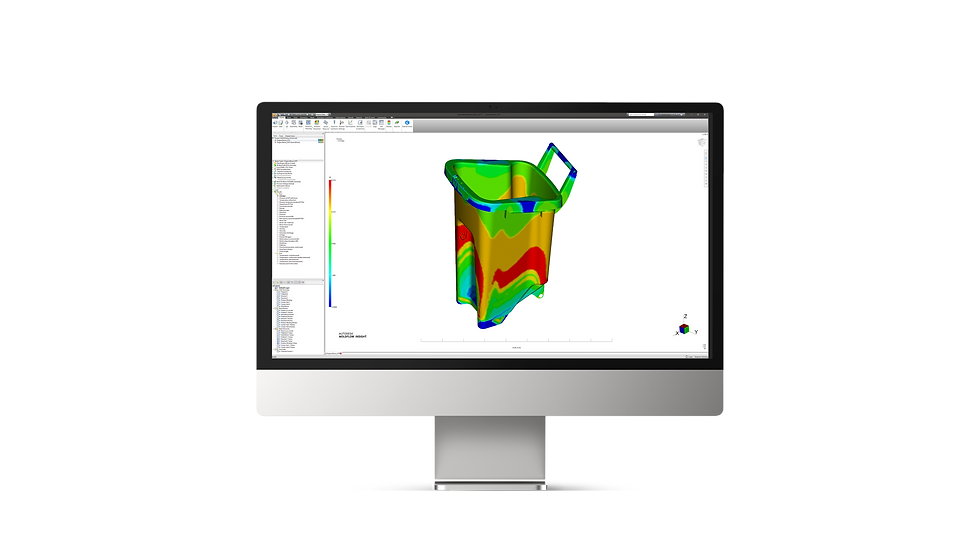
Filling analysis is the fundamental building block upon which all molding simulation is built.
It predicts the filling patterns for a number of gating scenarios and identifies the one most beneficial to the part quality and molding efficiency.
Filling Analysis

Cooling Analysis solves the problem of providing both uniform and efficient cooling
to an injection mold, leading to better part quality and increased profit margins
through reduced cycle times.
Cooling Analysis
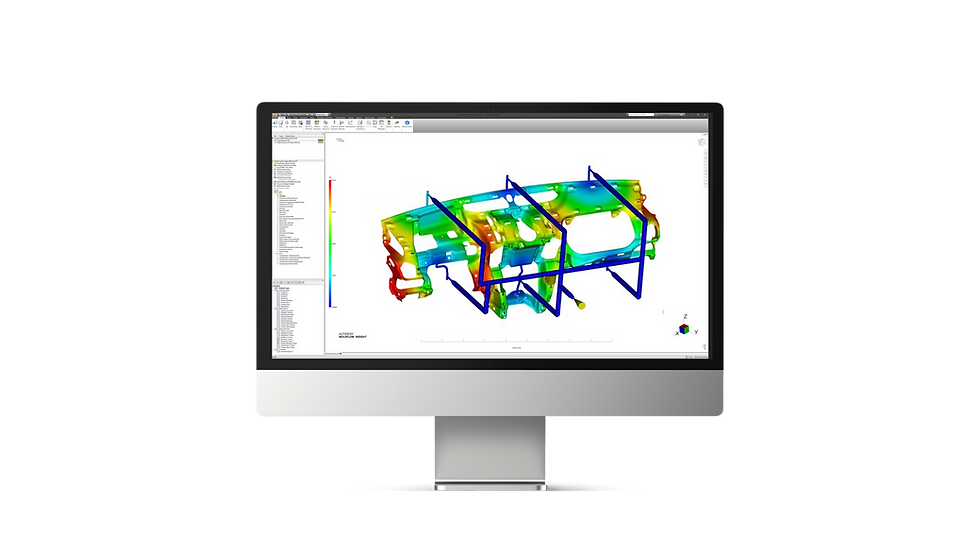
The ability to not only predict, but determine the cause of warpage is one of the real strengths of Moldflow analysis.
Our engineers use this information to significantly reduce
or eliminate the warpage in your part, to avoid problems down the road!
Warpage Analysis


Gas Assist analysis identifies the feasibility of achieving efficient
gas penetration in areas designed to be cored out.
Gas Assist
Co-injection analysis will help determine the appropriate gate location and timing for shooting both the A & B materials. This optimizes the amount of B material being used
and keeps it from blowing through the A material.
Co-Injection
Injection-compression molding is often used in thin-wall applications to help reduce molded-in stress by filling plastic into a slightly opened (i.e., thicker) mold and closing the mold to complete the filling. Analysis helps determine the best gate locations and the resulting decrease in clamp force requirements.
Injection Compression
2-shot analysis requires balanced gate locations that avoid prominent knit lines.
Air traps for the 2nd shot should be pushed to the parting line instead of up
against the 1st shot material.
2-Shot


Core shift analysis identifies excessive shifting of deep cores due to pressure imbalance and its resulting effects on the thickness of the plastic walls.
Core Shift
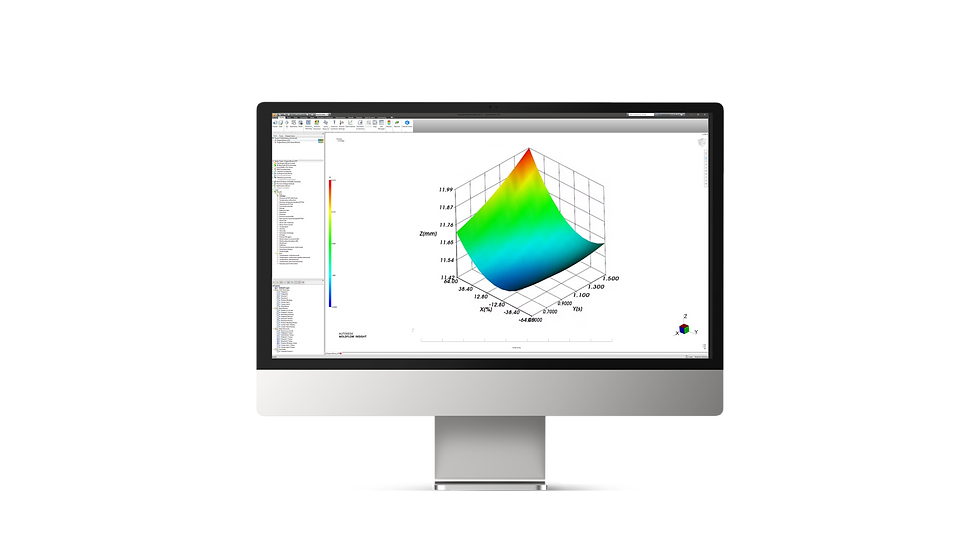
DOE analysis identifies which inputs are most influential and calculates
their level of influence on any number of outputs.
DOE
_edited.png)

Fiber orientation analysis is essential to accurate warpage predictions and helps determine the best gating and filling pattern to deliver the most advantageous fiber orientation.
Fiber Orientation
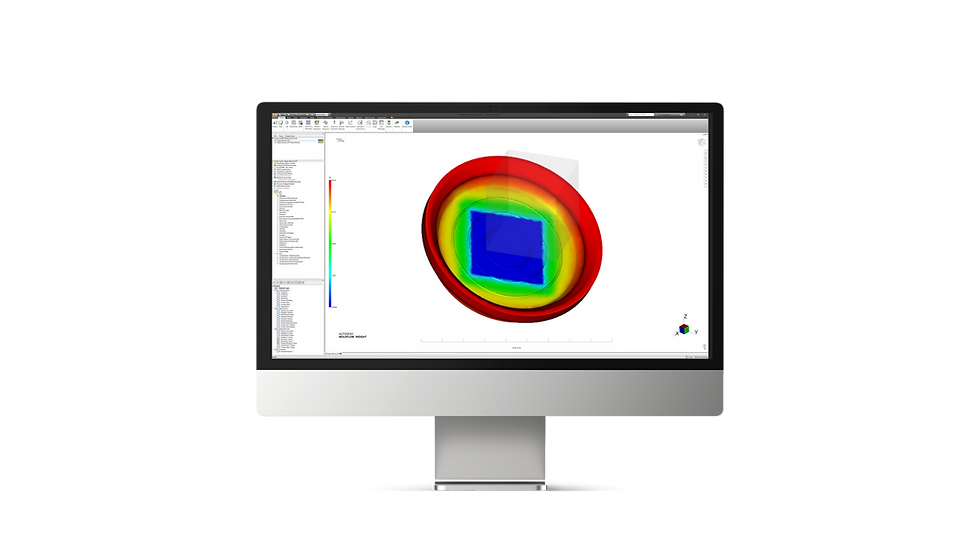
Compression analysis identifies the best location for the placement
of the “charge” to provide complete and balanced filling.
Compression

%20molding%20is%20a%20mechanical%20foaming%20process%20used%20to%20lightweigh.png)